Applied AI ... Who to call first?
can you spot the firms with the most to gain from the outside?
AI is going into all sorts of business processes at the moment, with results that range from transformative to embarrassing. Most of that variation isn't in the technology, it's in the choice of where to point it. Operations Research has spent about eighty years on that question, but it almost always answers it from the inside, using a client's private data and the people who already know the business.
I wanted to know whether you could do it from the outside instead. Every UK company files accounts, those accounts are public and free, and there are a couple of million of them ... so could you work out which firms have the most to gain before you've spoken to any of them?
The bottom line: yes, up to a point. I can rank an industry by how much headroom each firm is carrying, and I can name the real competitors that prove the headroom is reachable. What I can't tell you is whether any particular firm will actually get there - you can only see that from the inside.
The tool for the job here is Data Envelopment Analysis, a linear programme that takes the best performers in a peer group, joins them into a frontier, and measures everyone else by the distance back to that line. It's asking how much better a firm could do, given what its peers already manage.
The idea in one picture
Every firm in a given industry is plotted by what it earns from each resource, with return on capital along the bottom and profit per employee up the side. Up and to the right is better.
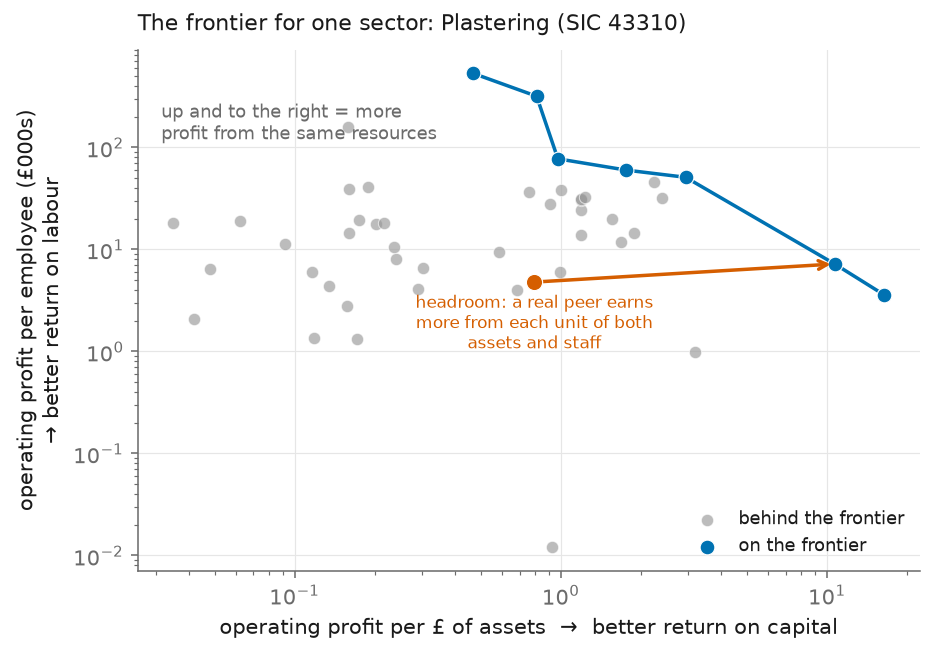
The blue line is the frontier, and the firms sitting on it beat everyone else on both measures at once. Everything behind the line is a candidate and the arrow is the gap. Because the frontier is built from real companies you can also blend them, which lets you ask a rather more pointed question ... how well would this firm do if you rebuilt it out of the best parts of its competitors?
Here's the answer for one care home operator, straight out of the report. Florence Care Reading, 81%. Grove Care, 11%. Acorn Lodge, 8%. Those are three real firms blended into a single composite, and that composite holds no more assets and employs no more staff than the operator being measured. The composite just earns more - or it would if it were a real firm.
What you actually get from a filing
Companies House publishes around 10,400 filings a day, tagged and machine-readable, and most of them are a balance sheet and very little else. Employee numbers are almost always in there. Operating profit is tagged less than half the time, which is awkward for a model that exists to explain profit.
The bigger problem is that some of the numbers are simply wrong. As an example, one motor group filed 427,000 employees against £273m of turnover, which would make a regional car dealer a larger employer than Tesco. Its own accounts give it away, because an untagged note further down splits that same headcount into 158 sales, 209 aftersales and 60 administration. The filing software had applied the document's thousands scaling to a figure that was already absolute, and about sixty firms in the panel managed the same trick.
A bit of noise matters more than it sounds, because DEA is deterministic. A firm like that doesn't just misreport itself ... it lands on the frontier, and then every honest competitor in the sector gets measured against a fiction. In total, I reckon about 85% of time this little project took was spent exploring, cleaning, reconciling, sanitising and double-checking the raw data.
The model
The output is operating profit and the inputs are total assets and headcount. That's all. Every extra input you add makes each firm look a little more like a special case, until eventually nothing can be compared with anything. Two inputs, one output ... doesn't really get much simpler and its barely a model.
About a third of these firms report a loss and classical DEA needs positive numbers, so I used the Range Directional Model instead. It works in differences rather than ratios, which lets the losses go in as they are and keeps the question the right way up.
Comparability is handled as a constraint inside the programme rather than as a filter in front of it. Every firm gets scored against its whole sector, but only certain firms are allowed to be its benchmark ... not its own subsidiaries, not firms an order of magnitude smaller, and not firms whose margin is so different it suggests they're really in another business. The report then names every benchmark firm and its weight, which matters because SIC codes are self-declared at incorporation and effectively never corrected.
Some industries have nothing to find
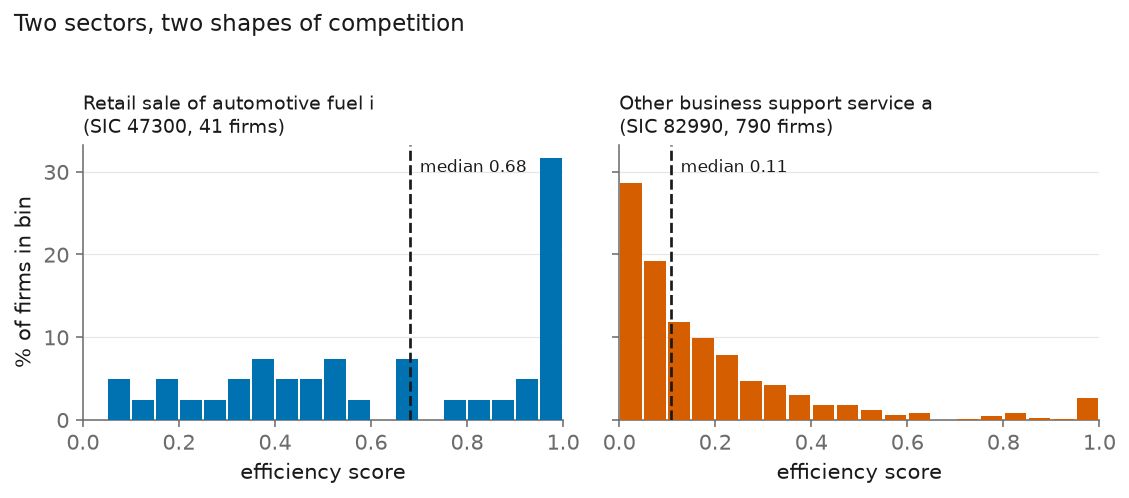
I ran the whole register, which came to 19,010 datapoints over 14,460 companies in 156 sectors, out of a panel of about 62,000. Industries turn out to bunch very differently. Some companies declare more than one SIC code and I've scored them in each industry, which is why there are more datapoints than actual companies.
| SIC | Sector | Firms | Median eff. | % at frontier |
|---|---|---|---|---|
| 50200 | Sea and coastal freight | 40 | 0.96 | 50% |
| 47300 | Retail sale of automotive fuel | 41 | 0.68 | 32% |
| 87300 | Residential care for the elderly | 129 | 0.59 | 22% |
| 43310 | Plastering | 47 | 0.59 | 36% |
| … | ||||
| 56103 | Take-away food shops | 107 | 0.12 | 14% |
| 82990 | Other business support | 790 | 0.11 | 3% |
| 62090 | Other IT services | 359 | 0.10 | 6% |
| 90010 | Performing arts | 80 | 0.08 | 11% |
Sea and coastal freight sits at 0.96 with half its firms already on the frontier, I guess because everyone owns much the same ships and runs them much the same way. It's an efficient industry and there's nothing to find there, which is worth knowing before you spend a week finding it. Performing arts sits at 0.08 and fans out across the whole range.
Two kinds of gap
The distance back to the frontier splits into two halves, and they want completely different conversations.
The first half is slack, which is just extra resource the benchmark doesn't need in order to perform. One furniture retailer in the panel makes £608k of operating profit on £11.6m of assets, and comparable retailers make that same £608k on ~£5m of assets. Its staffing is fine and the whole excess is sitting on the balance sheet, so that's a conversation with a finance director about capital and nobody needs to go anywhere near the shop floor.
The second half is the radial gap, which is execution, and it's the more interesting of the two from my point of view. One residential care operator holds £14m of assets and employs 110 staff, and so do its peers ... all seventy firms in its benchmark are built the same way. It sits at the 19th percentile with no surplus to shed anywhere, so it has the same resources as its competitors and less profit to show for them.
Whatever explains that must be in the running of the place, which means occupancy, fee mix, rostering and the cost of covering a night shift - or whatever the constraints in care homes are. Those are scheduling and allocation problems, which are precisely what optimisation, and increasingly AI, can help with, once they are sitting inside the process. A large radial gap in an otherwise homogeneous sector is a strong signal we can see from the outside that there's something worth improving on the inside.
What it won't tell you
DEA compares two firms standing still, so it measures the gap rather than the crossing. Some of that gap never reaches the accounts at all ... a theatre company behind the frontier might be badly run, or it might just be short of the one director everybody wants to work with, and talent doesn't get tagged in iXBRL. Headroom means unrealised performance, but it doesn't mean it's realisable.
I also don't know if it works in practice, because I haven't called as bunch of high-headroom companies, persuaded them to let me do "AI" on them and observed the results. I guess that part will have to wait.